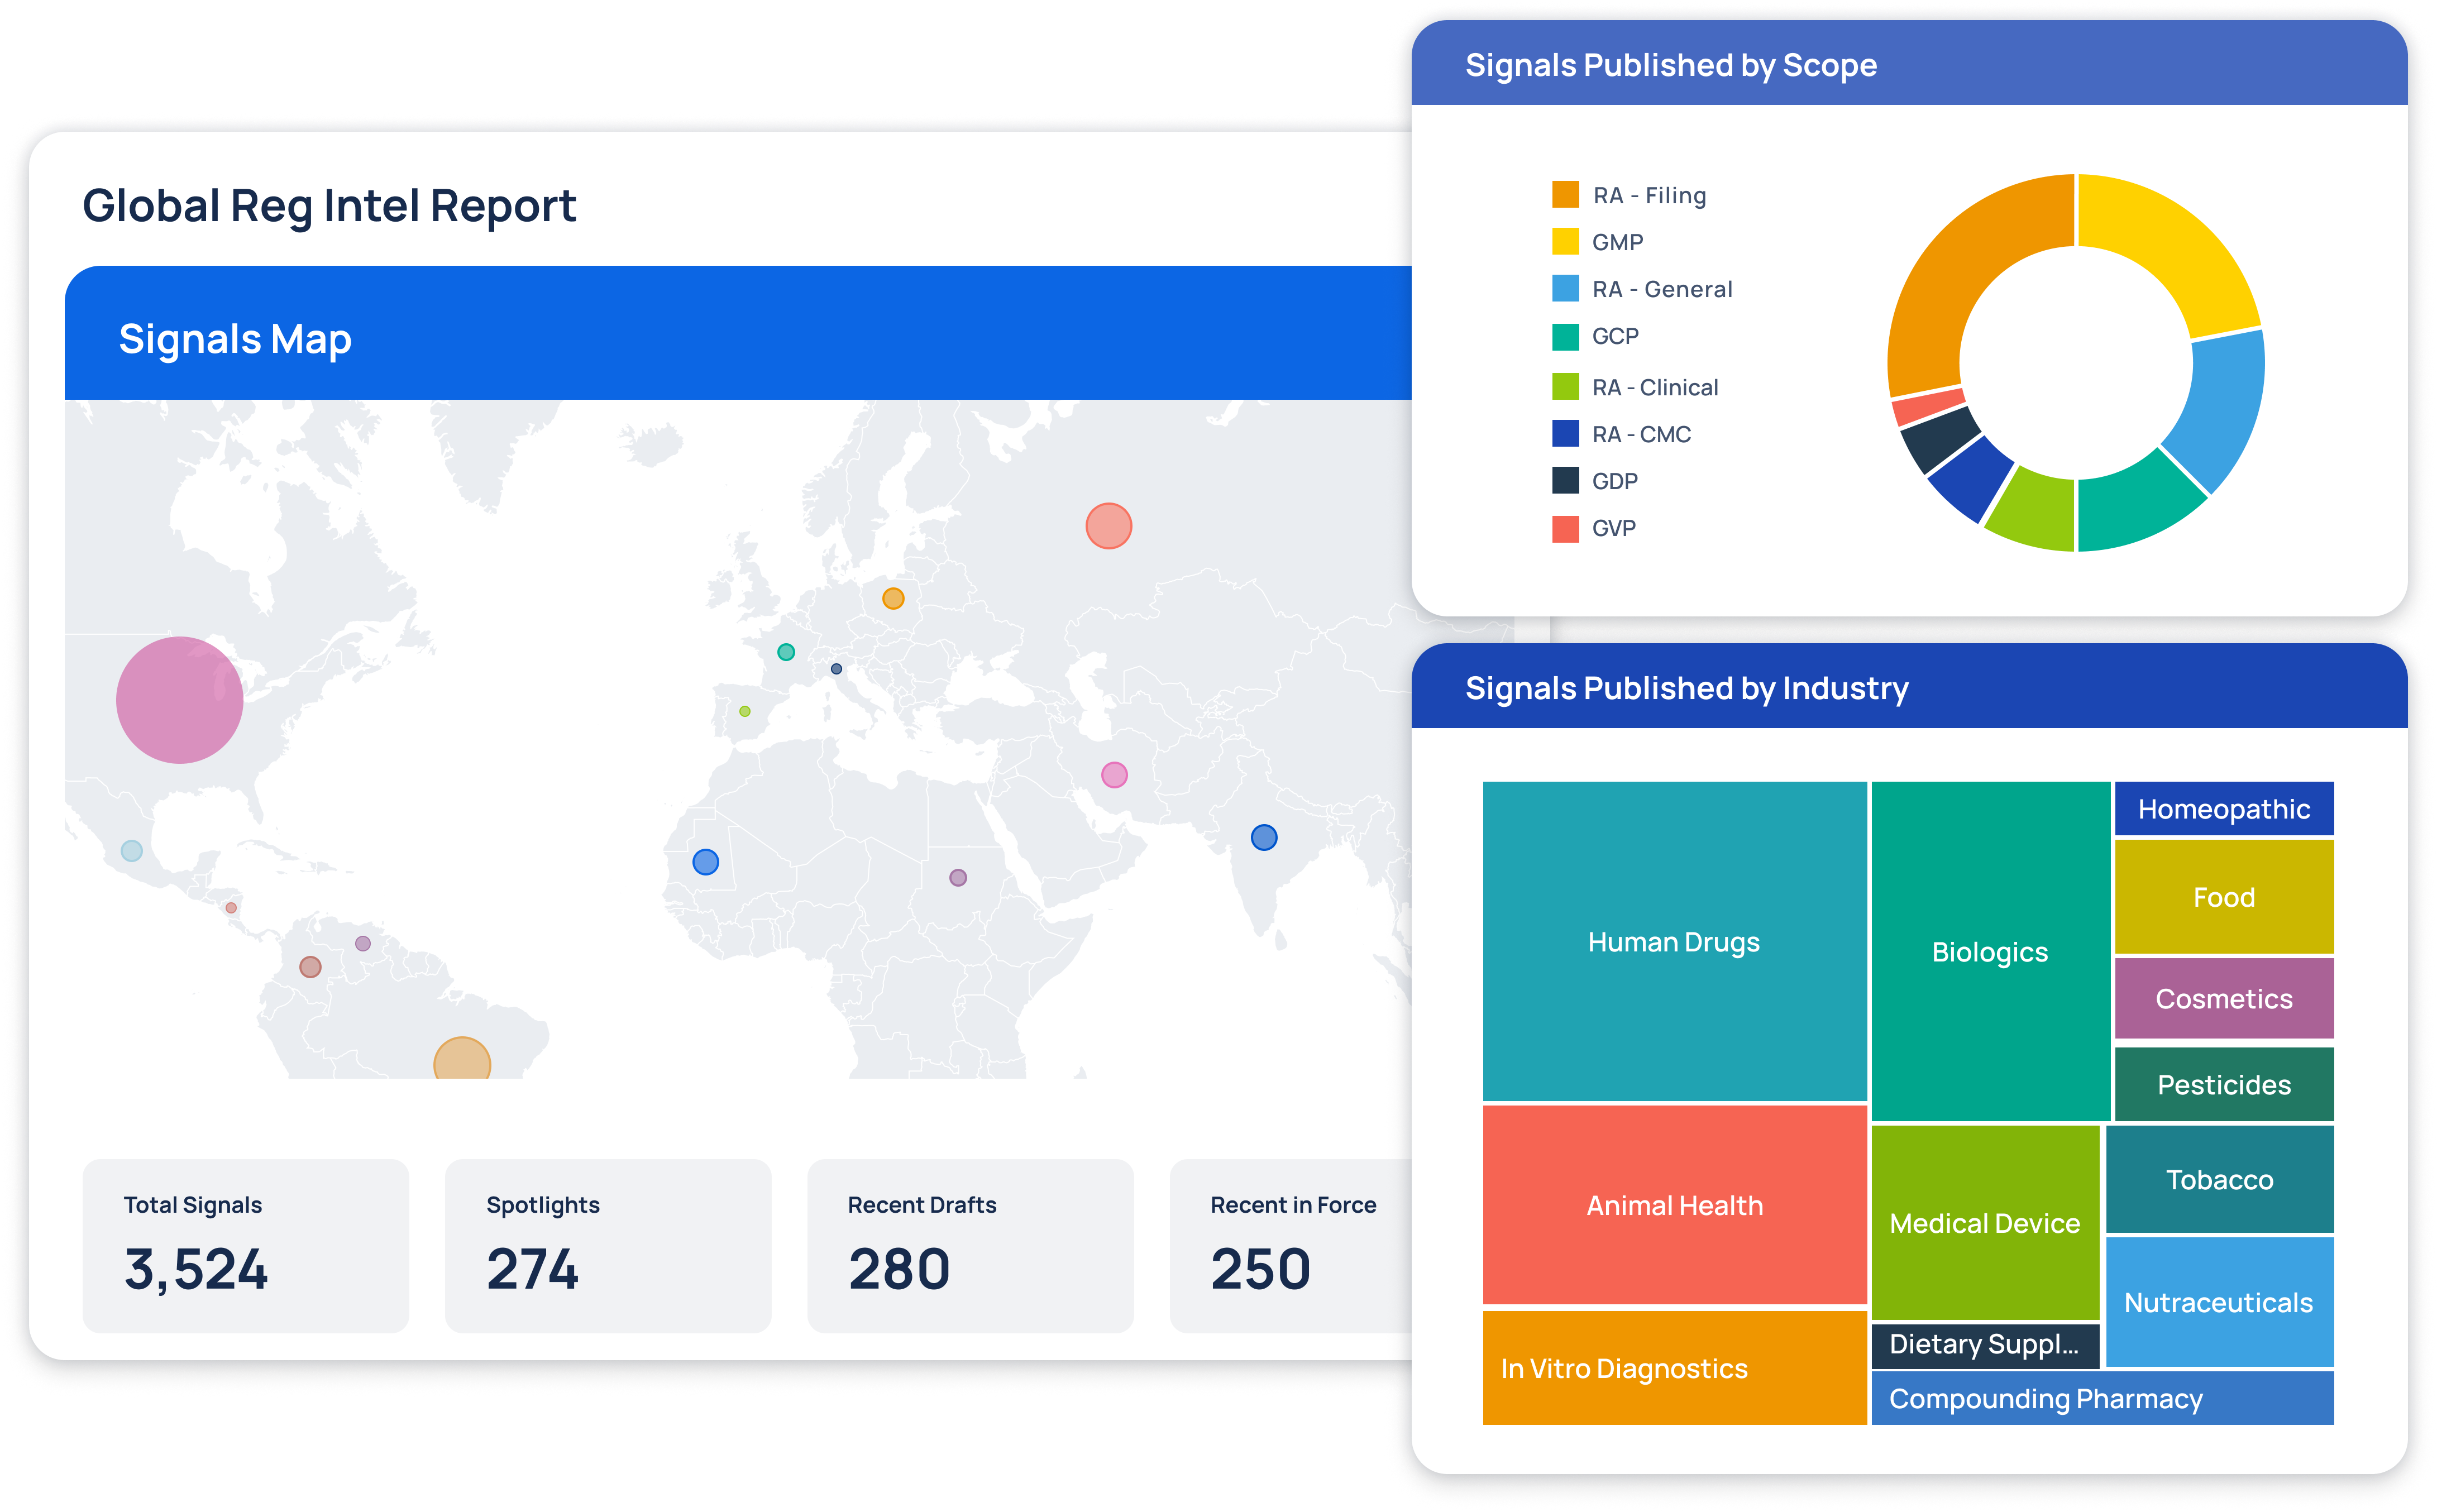
Transforming fragmented regulatory data into navigable intelligence for top pharmaceutical companies.
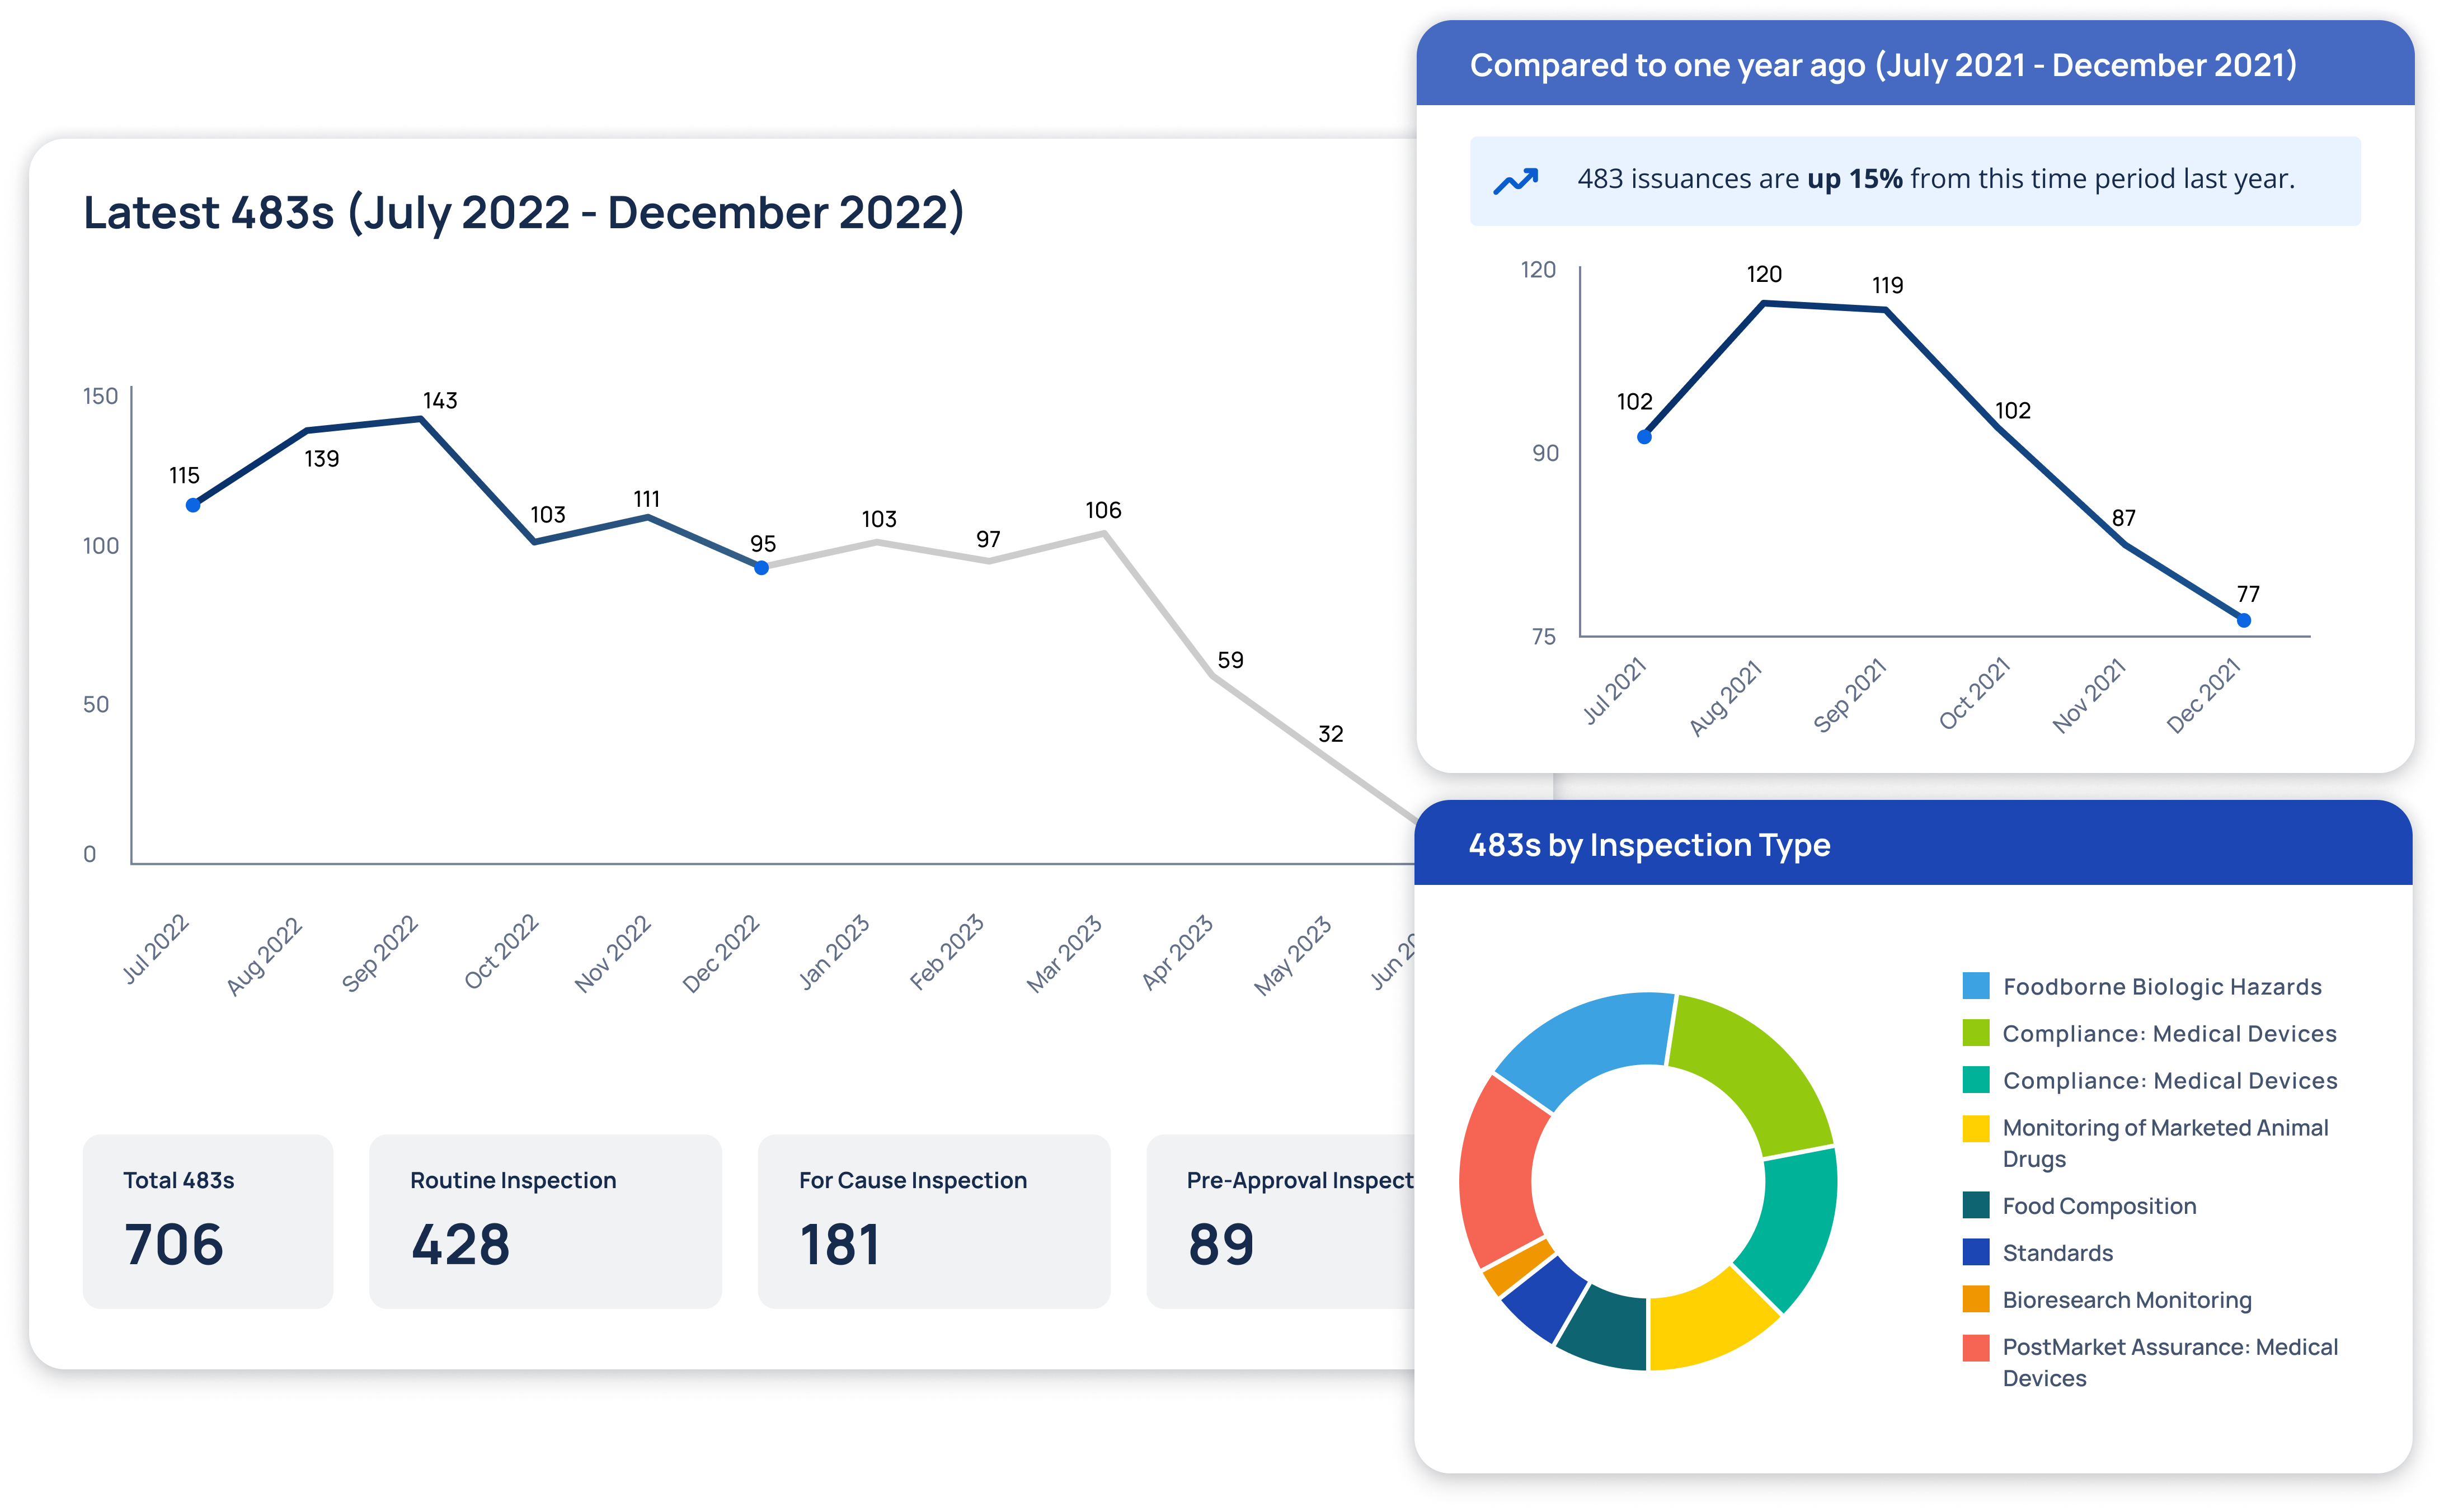
At Redica, we used GPT-4o and a knowledge graph to turn fragmented pharma regulatory data into real intelligence. We built a system that connected guidance, inspections, enforcement actions, and CFRs so users could actually navigate it. I used GPT-4o to extract relationships, summarize documents, translate non-English content, and surface links others missed. Users could chat with any document, auto-generate site risk briefings, and explore complex topics without slogging through PDFs. The result: faster answers, clearer context, better decisions.
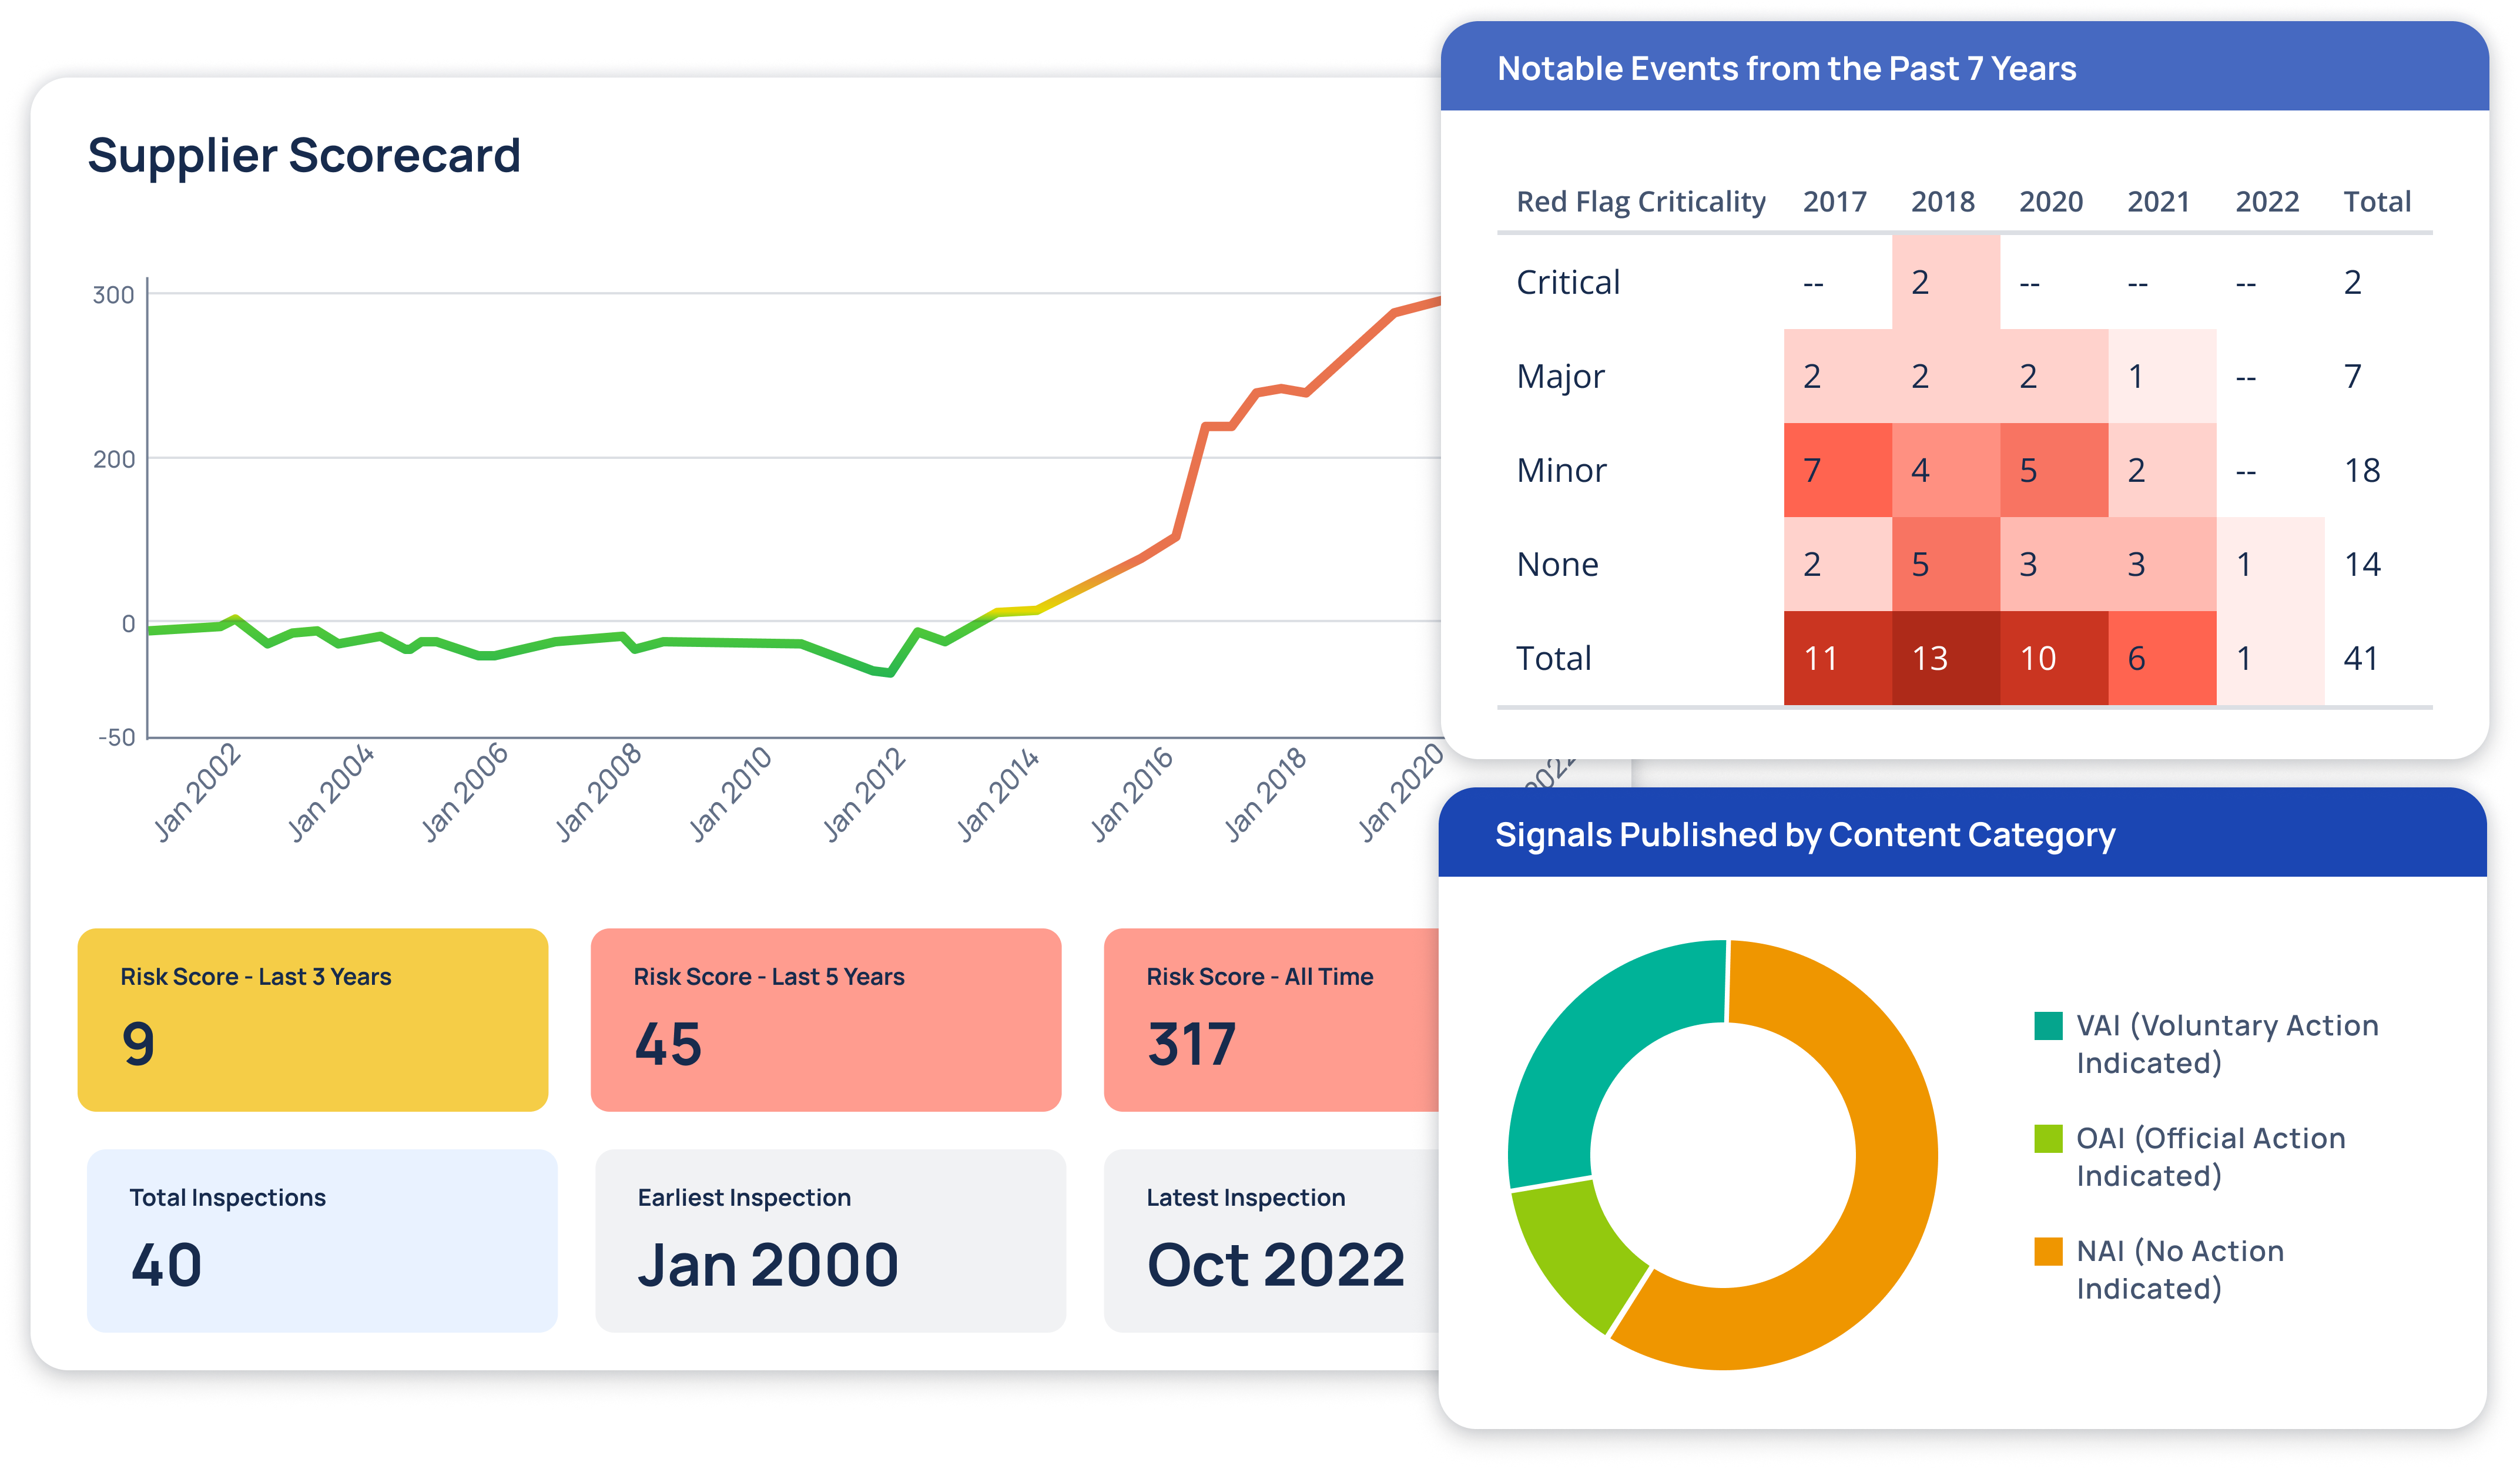
Redica had deep inspection data. Structured, clean, and trusted by top pharma companies. But their regulatory intelligence product was nascent. No structure. No connection to anything else.
The challenge: take a messy pile of guidance, warning letters, and enforcement actions, and make it usable. Not just searchable. Navigable. It needed to show context across regulatory activity, inspections, and risk so QA, compliance, and strategy teams could see the patterns before they turned into problems.
The data existed. The relationships didn't. Our job was to build those links at scale.
Most systems pile on more data. We focused on surfacing what matters and how it’s connected.
We started by defining the objects that mattered:
Each object had metadata. Each link had provenance and weight. We used GPT-4o to extract candidate relationships, LangChain to chunk and parse long-form documents, and Neo4j to store and traverse the graph. I worked with engineering on the schema design and defined the UX around exploring these relationships without overwhelming users.
AI that actually helped people get their work done
The graph gave us structure. GPT-4o helped us pull meaning from inspections, enforcement actions, and regulatory documents. We used it to cut through noise, reduce manual work, and get users the answers they were looking for—without wasting their time.
Most of Redica's users aren't searching for PDFs. They're trying to answer questions.
We added chat to any node in the graph. You could open an inspection or guidance doc and ask a real question. The model used the graph context and source text to give a useful answer, with references. No magic. Just fast access to information that mattered.
A lot of documents in Redica had no summaries. Many weren't in English. That slowed everything down.
We used GPT-4o to fix both.
Every document now has a clear, scoped summary that regulatory teams can scan quickly. If the original language wasn't English, we translated it. If it lacked metadata, we filled it in with topic and geography. We gave users a reason to open the document instead of skipping it.
Some documents are related. Some just seem like they are.
We used GPT-4o to identify connections that weren't obvious through keywords. For example, an FDA observation on inadequate process control linked to an EMA guidance on aseptic processing. Same theme, different terms. The graph didn't see it. The model did.
We surfaced these links as "related guidance" or "related inspections" in the UI. It gave users context without needing them to know the right words to search.
Customers spend hours compiling reports before audits or internal reviews. They pull citations manually, summarize findings, and guess what context to include. We built a tool that does most of that for them.
You enter a site or manufacturer. It pulls in relevant inspections, observations, enforcement actions, linked documents, and guidance. Then it assembles a briefing that's actually readable. Structured. Reviewable. Editable.
It doesn't replace judgment. It just saves the team from doing the same work over and over.
Defined schema alongside engineering and data science teams
Mapped product requirements to user-facing features and model evaluation
Set evaluation metrics: recall of relevant nodes, user task completion, query latency
Prioritized development based on customer interviews and feedback
Built feedback loop with SMEs to validate edge accuracy and reduce false positives
Scoped and reviewed API contracts for frontend graph exploration tooling
Regulatory teams can now see when new documents signal changes in inspection behavior
Across 5 core object types
Connected intelligence
Median after optimization
vs keyword search
Closed in 6 weeks
Guidance links surfaced
Cross-jurisdictional intelligence reveals hidden regulatory patterns and precedent connections
Metric | Keyword Search | Graph Query |
---|---|---|
Avg. relevant docs found | 5.7 | 11.2 |
Time to first insight | 3m12s | 38s |
Tasks completed (SMEs) | 54% | 92% |
# of hops to full context | N/A | 2.3 |
Fast, deep, and useful—the graph changes how users get work done
We limited default traversal depth for common queries and precomputed relationship paths for the most used node types. Redis handled caching. This kept UX responsive without oversimplifying the graph.
We had regulatory experts from top pharma companies on staff. They reviewed relationships directly. If a link didn’t hold up, it was removed. We didn’t pad counts or chase novelty. The graph had to reflect reality.
We also built feedback tools into the product. Early on, we weighted input from a trusted group of power users. They knew the space and gave direct, actionable feedback. It helped us catch weak connections and keep the signal clean.
Plugging the graph into dynamic monitoring. Trigger alerts when new documents strengthen risk signals for a known site. We already started work on query-driven workflows and narrative explanations on top of the graph engine.
We turned a disconnected regulatory corpus into a navigable graph with provenance. Guidance, inspections, enforcement actions, and CFRs linked in one place.
Users stopped guessing keywords and hopping tools. From a citation to a finding to related guidance in a few clicks. Time to first insight 3m12s→38s. SME task completion 54%→92%.
Teams could track issues across sites and regions and prep for audits without copying data by hand. It reflected how people actually work and what they need to move faster and make better decisions.
I’ll help you define objects and relationships, set evaluation, and use LLMs where it adds value. If you have volume and messy text, we can scope a pilot in ~4-8 weeks and measure time to insight and task completion.
Talk About Your Data